LoRaWAN 101 with Arduino MKRWAN 1300 and Helium – Part 2
In my last post, I showed how to connect an Arduino MKRWAN 1300 to the Helium LoRaWAN network and send a message. In this post, we’ll look at how to configure the decoder and integration functions within the Helium console to send our message data to MyDevices Cayenne.
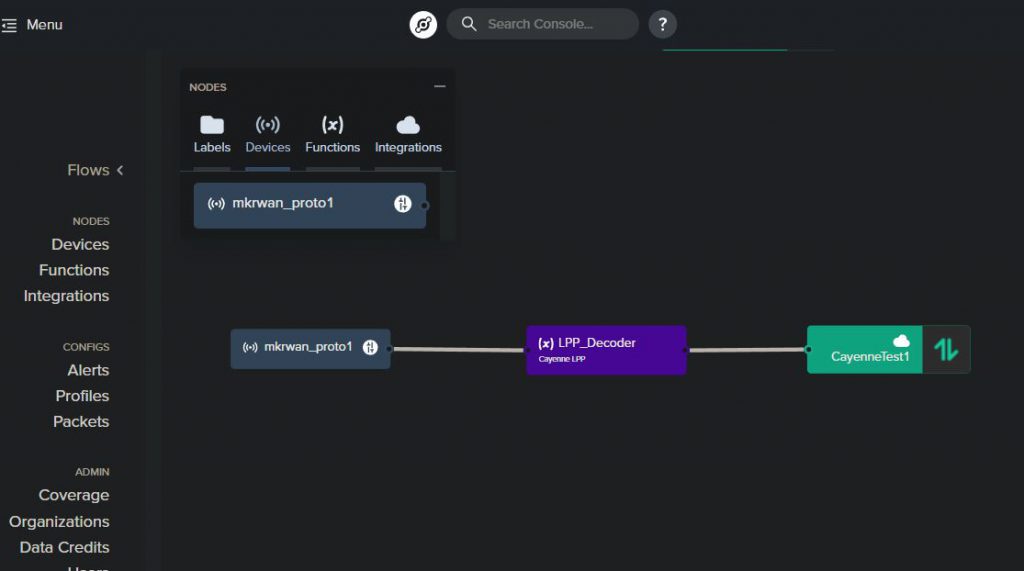
To start, follow this tutorial from Helium to log into the MyDevices Cayenne console, add your Arduino, and then add the Helium integration within the Helium console. Next, we’ll create a Cayenne Low-Power-Protocol decoder function which will take our payload and format it in a way which Cayenne can interpret. Within the Helium console, click the “+” button to add a new function, enter a function name, and then select “Decoder” for function type and “Cayenne LPP” under “Choose Format”. Finally, to tie these pieces together, we’ll create a “Flow” to send the incoming data from the MKRWAN through the Cayenne LPP decoder function and then up to MyDevices Cayenne. You simply click and drag each node item from the “nodes” menu onto the flow area, then click and drag connectors between the node items. Below is a screenshot of how the node should be configured for reference:

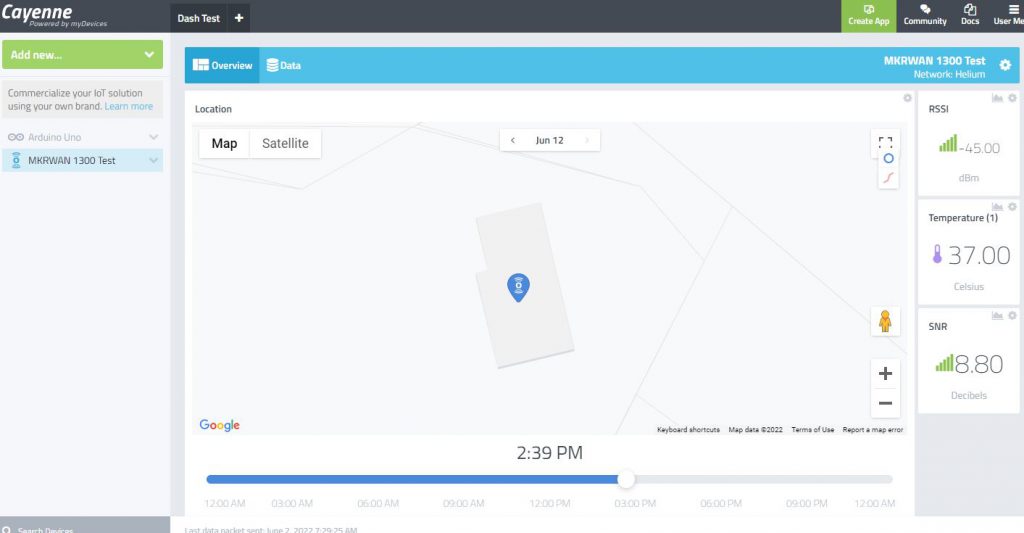
With the configuration now complete, fire up your Arduino again with the code from Part 1, open the serial monitor, and send another message with a number in the message field (i.e. 30). If all is configured correctly, you should see RSSI, Temperature, and SNR data show up on the device page in the Cayenne console.

At this point, all you’d need to do to get a fully functional end-to-end (if basic) IoT solution is wire up an actual temperature sensor to your Arduino, modify the code to read the temperature sensor value and set it to the “msg” variable, and then change the function to run every minute or two on a timer. If you’re looking to report on a different environmental metric, you’d just need to change the lpp.addTemperature() function to the corresponding function for that metric (like lpp.addBarometricPressure()). You can find the functions for all the different measurement metrics here.
I really enjoyed building out this basic IoT proof-of-concept and plan to flesh this out into something more production ready. While the Cayenne platform is good, it does appear to be lacking some more advanced charting/visualization found in other platforms, so I may see if I can get this data pumped into something like ELK or Grafana. More IoT posts to come!